
The Water Quality Research Foundation (WQRF) plays a pivotal role in advancing the understanding of water quality issues through rigorous research and data collection. One of the significant outcomes of WQRF’s initiatives is the creation of comprehensive contaminant maps. These maps serve as critical tools for water quality professionals, policymakers, and the general public, enabling them to identify and address water contamination issues effectively. This article explores the methodology behind the WQRF-funded data collection, the significance of the contaminant maps, and their implications for water quality management.
Understanding the WQRF
The Water Quality Research Foundation is dedicated to improving water quality through research, education, and advocacy. Established by the water treatment industry, the WQRF focuses on addressing pressing water quality challenges, including the presence of contaminants in drinking water supplies. By funding research projects and data collection efforts, the WQRF aims to provide actionable insights that can lead to improved water treatment practices and enhanced public health safety.
Objectives of WQRF-Funded Research
The primary objectives of WQRF-funded research include:
– Identifying Contaminants: Understanding the types and sources of contaminants that affect drinking water quality.
– Mapping Contaminant Distribution: Creating detailed maps that visualize the prevalence of contaminants across different geographic regions.
– Informing Policy and Regulation: Providing data that can inform policymakers in developing regulations and standards to protect public health.
– Enhancing Public Awareness: Raising awareness about water quality issues among consumers and stakeholders.
The Data Collection Process
The data collection process for creating contaminant maps involves several key steps, each designed to ensure the accuracy and reliability of the information gathered.
1. Defining the Study Areas
Before data collection can begin, specific geographic areas are defined based on factors such as population density, known contamination sources, and previous water quality studies. These areas may include urban centers, agricultural regions, and industrial zones, which are often more susceptible to various contaminants.
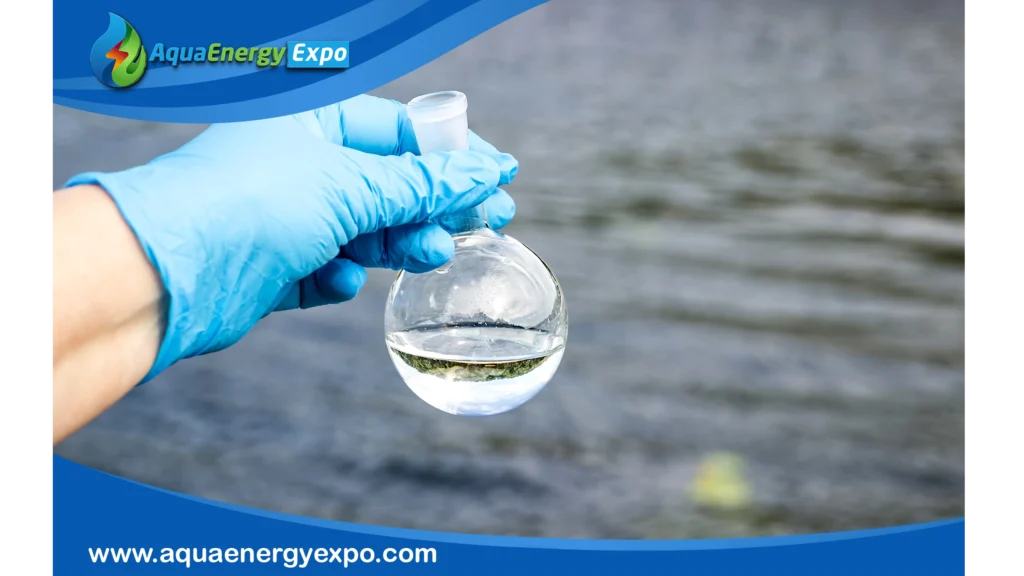
2. Sampling and Analysis
Once the study areas are established, water samples are collected from various sources, including municipal water supplies, private wells, and surface water bodies. The sampling process typically follows standardized protocols to ensure consistency and accuracy. Samples are then analyzed in accredited laboratories for a wide range of contaminants, including:
– Microbiological Contaminants: Bacteria, viruses, and protozoa that can pose health risks.
– Chemical Contaminants: Heavy metals, pesticides, and industrial chemicals that may leach into water supplies.
– Physical Contaminants: Sediments and particulates that can affect water clarity and quality.
3. Data Compilation
After analysis, the results are compiled into a comprehensive database. This database includes information about the types and concentrations of contaminants found in each sample, as well as metadata such as sampling location, date, and environmental conditions.
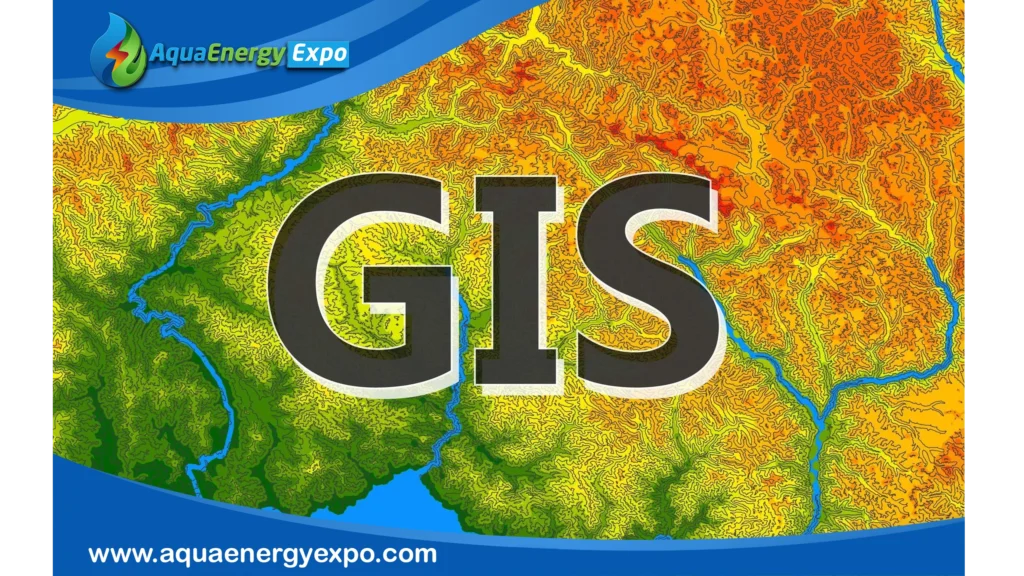
4. Geographic Information System (GIS) Mapping
The compiled data is then integrated into Geographic Information System (GIS) software, which allows researchers to create detailed maps that visualize contaminant distribution. GIS technology enables the layering of various data sets, providing insights into spatial relationships and trends.
Significance of the Contaminant Maps
The contaminant maps produced through WQRF-funded data collection are invaluable resources for multiple stakeholders, including water quality professionals, public health officials, and community members. Here are some of the key benefits of these maps:
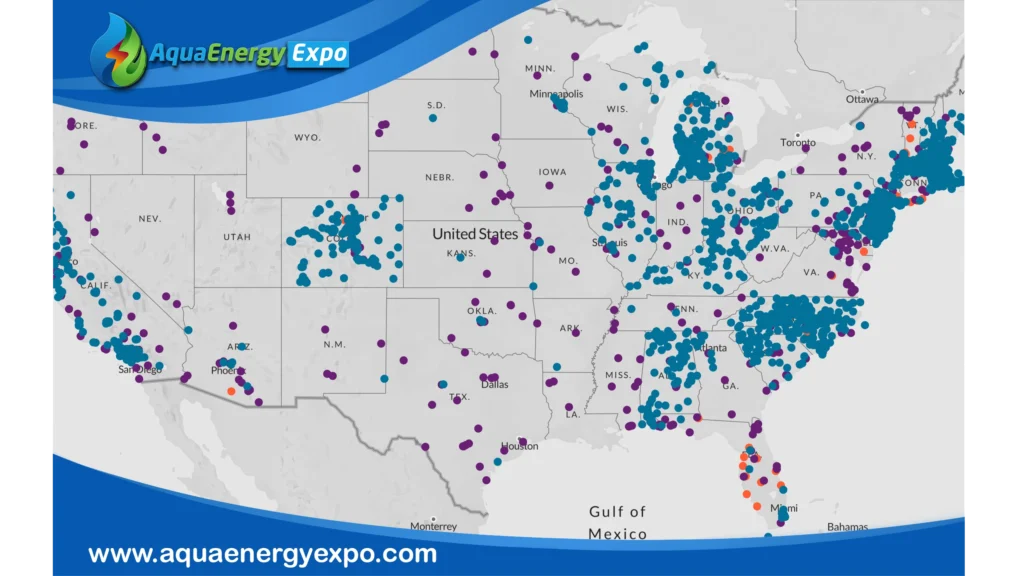
1. Visualizing Contamination Patterns
The maps provide a visual representation of contaminant distribution across different regions, helping stakeholders quickly identify areas with high levels of contamination. This visualization is crucial for prioritizing remediation efforts and allocating resources effectively.
2. Supporting Regulatory Compliance
Regulatory agencies can use the contaminant maps to assess compliance with water quality standards. By identifying areas where contaminants exceed allowable limits, regulators can take appropriate action to protect public health and ensure safe drinking water.
3. Informing Water Treatment Strategies
Water treatment facilities can leverage the information provided by the maps to tailor their treatment processes. Understanding the specific contaminants present in their water supply allows operators to implement targeted treatment solutions, improving overall water quality.
4. Enhancing Public Awareness and Engagement
By making the contaminant maps accessible to the public, the WQRF fosters greater awareness of water quality issues. Community members can better understand the potential risks associated with their water supply and engage in discussions about local water management practices.
Challenges in Contaminant Mapping
While the development of contaminant maps provides significant benefits, several challenges must be addressed to enhance the effectiveness of these efforts.
1. Data Gaps and Limitations
One of the primary challenges in contaminant mapping is the existence of data gaps. Not all water sources are monitored consistently, leading to incomplete information about contaminant distribution. Efforts must be made to ensure comprehensive data collection across all regions, including rural and underserved areas.
2. Variability in Contaminant Levels
Contaminant levels can fluctuate due to various factors, including seasonal changes, weather events, and human activities. This variability can complicate the interpretation of maps and necessitate ongoing monitoring to capture real-time changes in water quality.
3. Public Perception and Communication
Effectively communicating the findings of contaminant maps to the public can be challenging. Misinterpretation of data or fear of contamination can lead to public anxiety. It is essential for stakeholders to provide clear, accurate information and context regarding the implications of the maps.
4. Integration with Existing Data Systems
Integrating contaminant maps with existing water quality data systems can enhance their utility. However, achieving seamless integration requires collaboration among various agencies and stakeholders, which can be difficult due to differing data formats and standards.
Future Directions for WQRF and Contaminant Mapping
As water quality challenges continue to evolve, the WQRF is committed to advancing contaminant mapping technology and methodologies. Several future directions can be anticipated:
1. Enhanced Data Collection Techniques
Advancements in technology, such as remote sensing and real-time monitoring sensors, can improve data collection efforts. These technologies can provide more accurate and timely information about water quality, facilitating proactive management strategies.
2. Expanded Collaboration
Collaboration among researchers, regulatory agencies, and community organizations will be crucial for enhancing the effectiveness of contaminant mapping initiatives. By working together, stakeholders can share resources, knowledge, and best practices to improve water quality outcomes.
3. Increased Public Engagement
Engaging the public in water quality monitoring and mapping efforts can foster greater awareness and advocacy for clean water initiatives. Community-based programs that involve citizens in data collection and analysis can enhance the understanding of local water issues.
4. Development of Predictive Models
The integration of contaminant mapping data with predictive modeling can provide valuable insights into future water quality trends. By understanding how various factors influence contaminant levels, stakeholders can develop more effective management strategies and policies.
Conclusion
The WQRF’s commitment to funding data collection and developing contaminant maps is instrumental in addressing the critical challenges of water quality management. By providing valuable insights into the distribution of contaminants, these maps serve as essential tools for stakeholders at all levels. As advancements in technology and collaboration continue to evolve, the potential for improving water quality and protecting public health will expand significantly.
To explore the latest innovations in water and energy technologies, and discover a wide range of products and solutions from around the world, you can visit the virtual exhibition AQUA ENERGY EXPO which featuring leading companies in water treatment, desalination, and sustainable energy through the following link:
https://aquaenergyexpo.com/
References:
1- Water Quality Research Foundation – Research Initiatives: https://www.wqrf.org
2- Environmental Protection Agency – Water Quality Standards: https://www.epa.gov/wqs-tech
3- Centers for Disease Control and Prevention – Water Quality: https://www.cdc.gov/healthywater/drinking/index.html
4- National Ground Water Association – Groundwater Quality: https://www.ngwa.org
5- American Water Works Association – Water Quality Research: https://www.awwa.org
